Well the last couple of nights have been cloudy so not much observing was planned, but while out walking with Astronomer Assistants Ruby and Danny, the early morning skies seemed quite clear. Maybe we should shift our observing schedule to begin at say 3:00 AM? Ok, ok, maybe not, let's not even go there, so in the meantime we should check the science news and look at the upcoming calendar of events.
First up, is the announcement of the Nobel physics prize winners covering the recent detection of gravitational waves from collapsing binary black holes. I didn't make it up to Caltech for the news conference, but I did watch where Barry Barish and Kip Thorne talked about the events. They shared the Nobel with Rai Weiss of MIT, who first worked out the concept of detecting gravity waves. He was awarded 1/2 the prize money and Barish and Thorne split the remainder for their work on building the detector and working out what the characteristics of the signal from merging black holes would appear like here on Earth.
I have heard the winners speak many times at various conferences over the years and later at the bar the other conference attendees would be wondering and arguing who should be included among the prize winners. Well, now we know how the prize committee decided. Also, I was once in line to talk with Barish and was going to ask him about the so-called rubber ruler paradox, which would occur if the incoming gravitational wave stretched everything in its path as if it were a rubber ruler, and how it was still possible to detect gravity waves, but he had to move on before my turn came. Anyway, a couple of years ago, Searching for Gravity Waves, Dr. Gary, helped me through to the proper understanding and dissolving of the rubber ruler paradox, by his gentle words of "the gravity waves just invite something to move and do not force anything" and that the incoming waves are too weak to stretch anything but mostly space, that I finally began to understand.
 |
| Barry Barish and Kip Thorne at Nobel prize news conference (Source: Caltech) |
The new school year has got started already and that means that we have a brand new set of physics colloquia at UCI and CSULB to keep up with.
We have a scheduled tour of JPL coming up later in the month too as well as many of the usual OCA scheduled events. Unfortunately it turns out that our schedule is so busy that we probably won't be able to make any of those events. We have finally got a date for our next attempt at a night of observing on the 60 inch telescope at Mount Wilson. Hooray, we finally have our third attempt at getting a night there, which is especially exciting given the previous attempts that were either clouded out or not possible because of ash from a nearby forest fire. OCA Coordinator, Michelle has been very diligent over the past couple of years trying to herd this group of cats and their schedules and still finding and securing this date for our adventure. Thanks for all that, Michelle! Keeping our fingers crossed or whatever as scientists we can do to hope for the best and clear skies.
Also later this month there is the IAU gravitational waves in astronomy conference and tour of the LIGO observatory in Livingston, LA, which covers this new observational, non electromagnetic, window on the universe. See all of you dedicated physicist wannabes who are going to be there as well.
Now that we are back at the observatory, I finally unpacked this wonder globe that I picked up while on the cruise ship. The globe floats in a clear plastic shell and rotates inside it. I sometimes get swayed by impulse buying and gave into to this beautiful globe which is powered by regular room lighting and turns about 2.5 RPM by interacting with the earth's magnetic field. In other words its like a big compass, but keeps rotating all the time as long as the lights are on.
 |
| New globe, powered by room lights, rotates 2-3 RPM (Source: Palmia Observatory) |
The main attraction for me was that I couldn't initially figure out how it worked as it sat on the showroom floor and when it was explained that it worked off the earth's magnetic field, well, I just had to have it. In a previous life, I did a lot of analysis of different types of motors, some based on induction, some synchronous, some permanent magnet, some reluctance and even one that was superconducting, so I was quite curious about this "motor" also. Most motors work due to interaction between stationary and rotating magnetic fields, which creates the torque causing the shaft to rotate. I didn't realize that you could make a motor that used the earth's magnetic field, even though a couple of years back while working with Wants to build a Cubesat, Dr. Don, where we considered using the magnetic field in low earth orbit to change the orientation of a satellite. Nothing came from that study, but it was fun. Now, I just enjoy watching the globe turn while resisting the temptation to tear it apart and see how it is built inside!
Ok, since we didn't get any observing time in, let's review some interesting astrophysics and light curve analysis that enables finding out a lot about variable stars. Remember that when we talk about variable stars we mean starts whose light output is variable due to many types of factors, which include occultation in binary systems and sometimes just internal variation in heat generation.
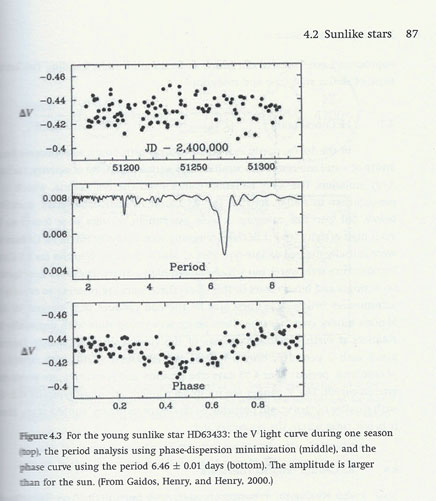
The chart below shows a time series of maybe a hundred observations, maybe one per night, of a variable star. This chart is copied from a great textbook on the subject, "Understanding Variable Stats". The brightness is reported as a differential quantity because it is measured with respect to a nearby comparison star which is known not be vary in light output.
 |
| Example showing variable star time series analysis (Source: "Understanding Variable Stars", John Percy) |
The three subcharts show the raw observational data, the calculated period that best fits the data and the same data points plotted with the same relative phase by adjusting all the data according to the period, in this case 6.46 days. Also, I don't know about you, but I don't see much periodic behavior in the phase data?
I have an interest and hope to collect data like this someday. Most amateurs with a telescope and camera can collect this type of data. But right away you can see that you need to collect close to a hundred data points, which could take close to a hundred days if you are able to get one data point every night. I am beginning to think that I really don't have the energy or desire to do this anymore. We will see what happens, but for now let's just go to one of the available online data catalogs and download some variable star observations and try out own hand at doing the analysis.
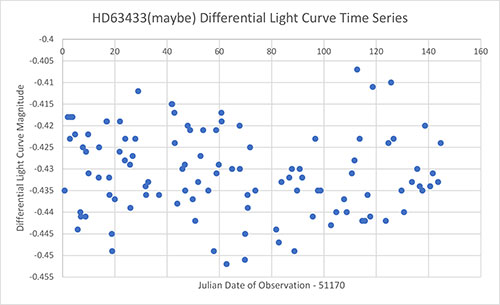
This chart shows some observational data from the referenced data source and if I am lucky it is for the same star as used in the textbook. HD63433 is a star that is regarded to be almost identical to our own sun and is therefore studied quite often. Using available data means I didn't have to worry about performing all the calibrations to get good data from your camera image, not to say also the time needed to actually make the observations. The dataset had already been reported for Julian dates corrected by subtracting 2,400,000, so I just continued by subtracting 51170, so that the data points began at time = 0 (just arbitrarily for convenience).
 |
| Light curve plot (Data Source: http://schwab.tsuniv.edu/papers/aj/youngsuns/hd63433) |
Now how do you examine the data and look for periodicity? Some of my astronomical software tools, like MPO Canopus, has built in features to help with this, but I don't yet know how to use those tools, so let's just use a Fourier transform, which I have used in the past. The plot below is based on the first 64 data points. Wow, what do we see? Surely, it is not obvious what the periodicity of this star is from this plot and it looks nothing like the sharp notch found in the chart from the text book.
Is this Fourier analysis done on the same star? Did I inadvertently download a different dataset? Did something else go wrong? I don't know, but decided to go ahead and estimated the period of the data at about, say 7, just based on the two peaks in the transform. If this were data from an unknown variable, it might very well be that multiple periodicities occur, but let's just go with 7 for now.
The chart below plots the observed dataset after adjusting the timing as if the period really was 7 days. Remember the phase varies from 0 to 1 and the periodic data just keeps repeating over that phase. Wow, this phase chart is completely unreal! This plot seems to indicate that there is a periodicity of just one day built into the data. Yes, there is something that happens every day and that is when the observations are made. But this does not make much sense. Our old friend from signal processing days, Nyquist Sampling Theorem, tells us that we can't reconstruct the signal unless the sample rate is at least twice the frequency of the event, which would represent events with periods greater than 2.
Well, I don't have any idea about what just happened. But this is another example of this blog just reporting what happened, positive or negative. I'm going to have to think about this problem a bit more. Maybe next week we can turn this "Darn!" into a "Hooray." I'm just glad this didn't happen after spending a 100 nights collecting the data and then finding that something should have been done differently.
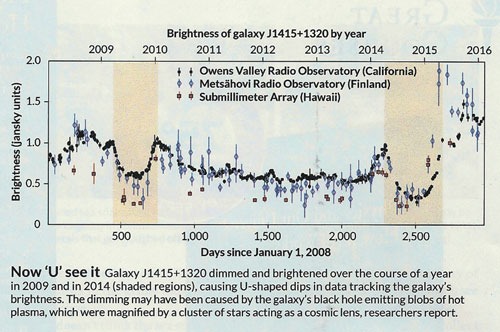
So, let's close out this post with some recent news on the same topic as light curve analysis, in this case in terms of variation in radio intensity from a galaxy with a black hole. The referenced Science News article reports how two dips in radio intensity over a 6 year period hopefully can be used to discover more about the formation of jets form a black hole. The object in question is a blazer, which is a super massive black hole that is emitting jets of radiation, and it just happens to be directly pointed at Earth. Ouch, if it were closer! Anyway, the authors point out how these observations enable learning more about the formation of these jets. Take a look at how noisy the time series is and how small is the dip in intensity which is the key point of the observation.
 |
| Light curves from black holes provide window into jets (Source: Science News Magazine, September 16, 2017) |
Until next time,
Resident Astronomer George
If you like things cosmological or astronomical you can follow other blog posts at:
www.palmiaobservatory.com


No comments:
Post a Comment