Well with no sunspots this week we had a chance to sit in on another presentation about the Event Horizon Telescope (EHT) and the shadow of the black hole in M87, which called for more homework on how radio interferometer arrays work to produce images.
One of our earlier blog posts, from March 17, 2017 , (http://www.palmiaobservatory.com/2017/03/maybe-about-able-to-see-black-hole.html) mention how we were waiting for the EHT collaboration to make the observation and how on April 15, 2019 at the APS April Meeting in Denver, CO, we sat in on a presentation by Shep Doeleman, EHT Director, on the first image of the black hole in M87. You can check out the details at that time at: http://www.palmiaobservatory.com/2019/04/event-horizon-telescope-eht.html
Now, Geoffrey Bower, EHT Project Scientist, made a presentation at the UCI physics colloquium with more details. Even though we have seen several similar presentations in the past, it seems that each time you can pick up something new.
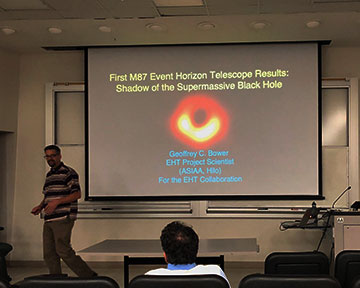 |
| Geoffrey Bower, EHT Project Scientist, presents at the UCI Physics Colloquium (Source: Palmia Observatory) |
Dr. Bower introduced the topic by reviewing some of the earlier views of M87 that have been made with the VLA, the VLBA and the Hubble Space Telescope (HST). Remember that M87, also called Virgo A Galaxy, is about 16.9 Mpc (Megaparsec) away, or if you like distances in lighyears, about 55 million lightyears. The whole galaxy is about 130,000 lightyears in diameter, so the apparent size as seen from the Earth is about 8 arc minutes in diameter.
Now for most of us visual observers we normally think of M87 as something that looks like this WikiSky image.
 |
| This image of M87 is normally what we think of when we consider the Virgo A Galaxy (Source: WikiSky) |
But when you get more and more resolution capability you can see much more detail as shown in this slide in Bower's presentation. The details that shows up in the jets from the black hole show up with much greater detail in radio observations.
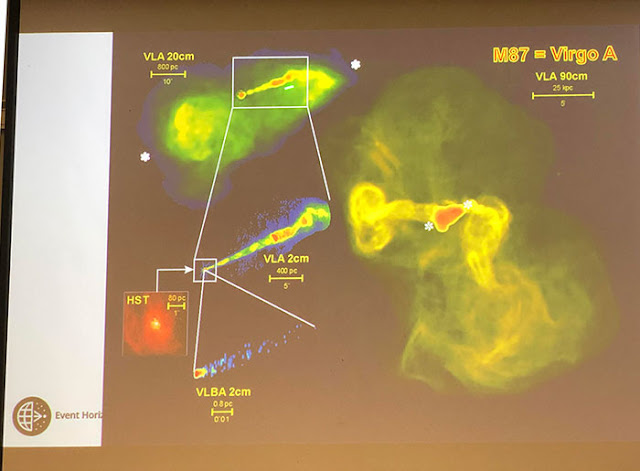 |
| Comparative size of M87 central core with VLA, VLBA and HST (Source: Geoffrey Bower, EHT Project Scientist) |
Next up, Dr. Bower discussed some of the theoretical understanding of what the environment around a black hole might look like. Theorists in 1973 and 1973 identified some of the issues. The gravitational effects of the black hole would be so high that light could actually orbit around the black hole. Most of these orbits are not stable, but any light that comes back to us from the black hole could have originated from almost any direction. Light from any accretion disk around the black hole would also be distorted by the time any of it gets back to us. He also said that given the mass of the black hole in M87, its event horizon would have apparent angular diameter of only 42 micro arcsec. Wow that is really small! In comparison with the black hole at the center of the Milky Way, because distance to us is about 1000 times closer, but the mass of the black is 1/1000 of M87, the apparent size of our very own black hole would be about the same apparent size.
 |
| Geoffey Bower explains history of predictions for images of black holes (Source: Palmia Observatory) |
Recall that in order to get enough resolution to see something so small as the event horizon around the black hole in M87 you need a telescope with very wide aperture. Rather than one big telescope, almost as big as the Earth, the EHT is made up of an interferometric network of telescopes located around the globe. Check out the locations of the observatories in this diagram provided by the EHT organization.
 |
| Radio observatories around the globe make up the EHT (Source: www.eventhorizontelescope.org) |
Now this time as I sat through another presentation on the image of the shadow of a black hole, I concentrated more on how it is actually possible to get an image of the effect. Remember that the EHT is a collaboration of radio observatories around the world and that interferometric techniques can increase the resolution from a single telescope. This next slide, from Bower's presentation, shows the pairing of all telescopes used in the study of M87 black hole shadow.
What does this slide show? Remember that all of the EHT observatories are in fixed positions on the Earth, but as the Earth rotates, the wavelength distance to M87 varies because the Earth is rotating So as the Earth rotates the phase of the received radio signal from M87 varies for each of the pairings between two of the EHT observatories. It is this combination of correlations between pairings of observatories that makes developing a high resolution image possible.
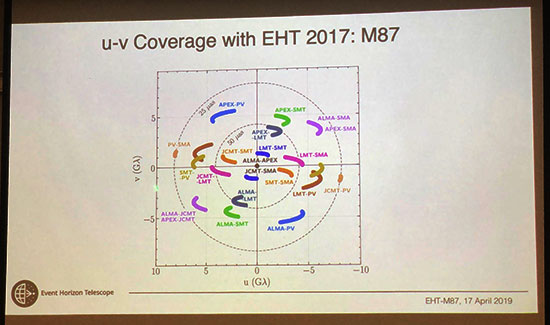 |
| Cross correlation between pair of EHT observatories on UV-plot (Source: Geoffrey Bower) |
Ok, but what are these u and v axes that are shown on the chart. This whole topic of axes on charts, many charts that I have seen at various presentations over the years, is key to understanding what the chart intends to explain. Previously, it has taken me more time just to understand the axes used in the presentation that by the time I get that figured out the presenter is on to the next slide and I missed what he was saying.
So, let's take a break from Bower's presentation and go out and do some homework to remind us what the uv-coordinate system is all about. Hey, it is pretty simple after all as this image from Wikipedia makes clear. The uv-system of coordinates just makes a transformation from a 3 dimensional object to a 2 dimensional plane. So, by displaying the EHT coordinates of the locations of the observatories located on a spherical rotating Earth, we get a better view of what they are actually observing.
Hey, so many the axes in Bower's previous slide have units of billions of wavelengths of the radio frequency used to make the observations?
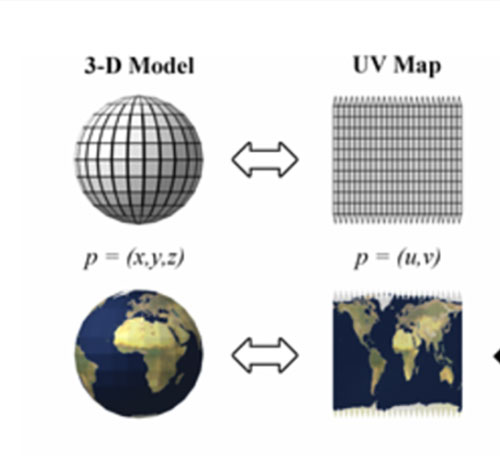 |
| Transformations from 3-D to 2-D plots (Source: Wikipedia) |
Ok, we now have to dig a little deeper into our homework to get any understanding of how an image can be formed by combining the signals coming in from multiple pairs of radio observatories. To get some more understanding of this issue, lets' go back to one of our favorite textbooks on the topic, which is "Radio Astronomy -- An Introduction" by S. Joardar and J. Claycomb.
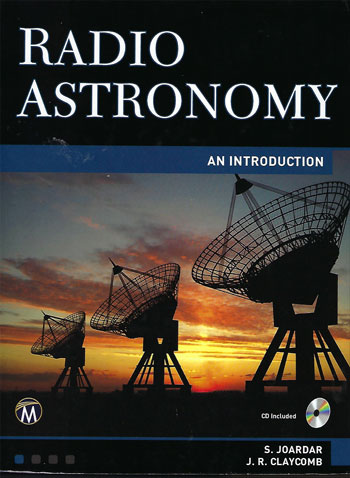 |
| Good reference textbook covering radio interferometry and imaging (Source: S. Joardar & J. Claycomb) |
The EHT radio observatories did not do any scanning of M87 in order to make an image of M87 black hole, but the rotation of the Earth did contribute to getting an image. First off, we should recall that if the radio antenna had been left fixed in position, as the Earth rotates the signal from the distant target would change as the target moved into and out of the beam of the antenna. You can see this in the figure from the textbook. The signal is really just an increase in amplitude of the received signal, which is a long way from an actual image of the radio source.
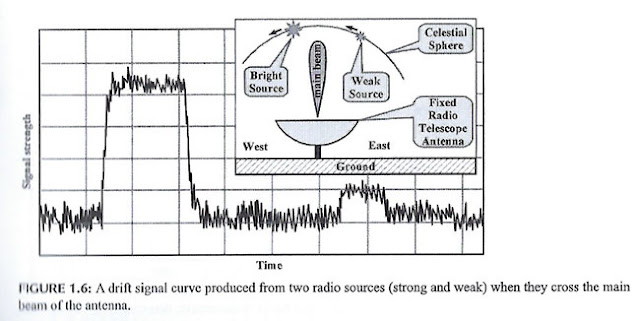 |
| Example of radio source as it drifts across beam of an antenna due to Earth rotation (Source: "Radio Astronomy", Joardar & Claycomb) |
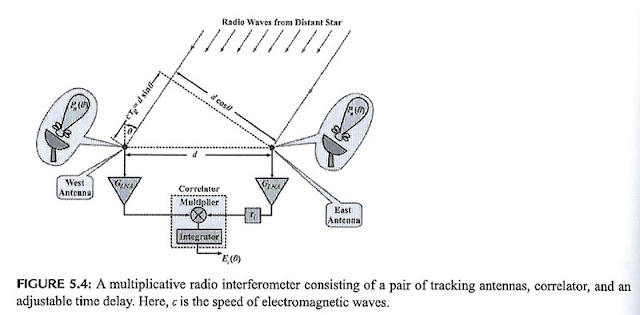
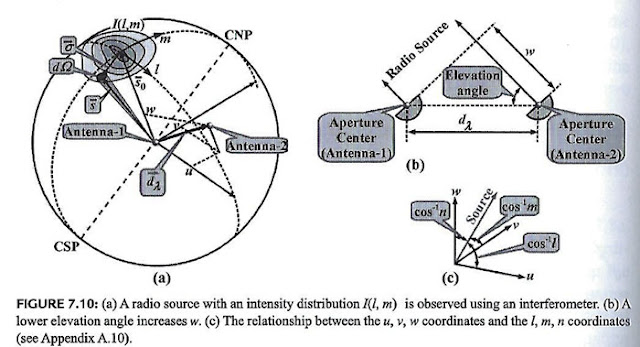
Another diagram in the great textbook shows two antennas set up as an interferometer. The time delay between signals can be adjusted to change the angle from which the signal is has maximum reception. So, if you have base pairs in both the x and the y direction you can start to develop an image of the distant object.
 | |
|
 | |
|
Finally, after another UCI Astrophysics seminar on axions and how axions might form the basis of dark matter. Most discussions of axions, which are a a particle invented, not yet discovered, to fix a problem in particle physics called the CP invariance, or some such of paradox. Hmm, not sure what that means, and most of which was way over my head, so I elected to meet up with Gravity Guy, Ken for a physics luncheon. Neither of us had a good understanding of the theory of axions so we just met for lunch and discussed other topics. One topic that came up was how much significance we should attach to theories that describe the big bang as really the result of a "big bounce", which means that the universe is though t to go thru a cycle of expansion, followed by contraction into a big crunch, which then somehow starts over again as a big bang.
Hmm, I never much really appreciated this theory and never understood how the universe could appear to be some symmetric and smooth as measured by the cosmic background radiation if the big bang were anything other than some sort of tiny quantum fluctuation? So, my counterargument to Ken was how could all of these galaxies falling back towards a common point result in such a smooth expansion again and again. My bias was that each universe starts off as some sort of quantum fluctuation, very smooth, and then just expands forever or maybe even contracts, if there is not enough dark energy, but not ending or beginning again with a big bounce. Anyway, we wondered how likely it would be for all of the galaxies contracting and falling together and wouldn't all of these galaxies just combine in a series of bigger and bigger black holes. Thanks for that discussion, Ken!
So, in order to get a sense of how big of black hole might have formed if all of the mass and stars in the Milky Way were to collapse into one gigantic black hole, we said we should calculate how big the Schwarzschild radius would be if the Milky Way were to collapse into one single black hole. It turns out that as I started to calculate the radius, which scales up directly with total mass, that I found the mass of the Milky Way in a table that already showed what the size the event horizon would be. It turns out that the event horizon for a black hole with the mass of the Milky Way would be about 1/4 of a light year. Wow, that is pretty neat!
So, if the big crunch and big bounce are to occur, the theory needs to explain how all of these millions of galaxies, some much bigger than the Milky Way, are not just going to collide an become an even bigger black hole! Maybe there is some way, but I will wait for more data and thinking about it before accepting the big bounce scenario! Another interesting thing in the table is that if the entire observable universe were to collapse into a black hole, its Schwarzschild radius would be, what?, 13.7 billion lightyears! What is going on with a number, so similar to the age of the universe, like that?
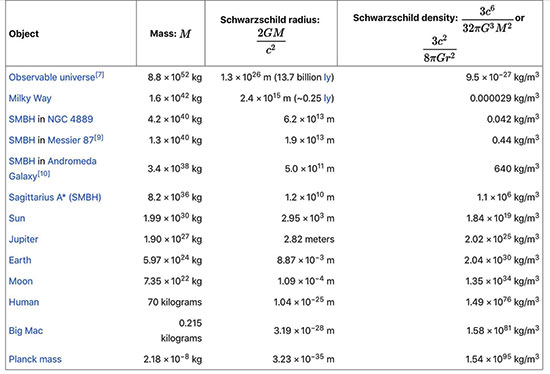 |
| Table of Schwarzschild radii for common objects (Source: Wikipedia) |
Until next time (sometime after the Super Bowl),
Resident Astronomer George
Be sure to check out over 300 other blog posts on similar topics
If you are interested in things astronomical or in astrophysics and cosmology
Check out this blog at www.palmiaobservatory.com

No comments:
Post a Comment