Greetings from Palmia Observatory
Well, we have finally completed making a month's worth of observations of the moon as it goes through the course of its changes in phase.
Recall, that we made this decision to complete a months worth of observations of the moon after former OCA Secretary, Bob Buchheim, was the featured speaker at the October monthly meeting of the Orange County Astronomers (OCA). The details of that meeting were presented in the blog post of October 23, which can be found at: http://www.palmiaobservatory.com/2020/10/hey-sun-is-waking-up-and-has-spot-oca.html
Bob has authored two books on how amateur astronomers can repeat some of the grand astronomical measurements from your own backyard. In this meeting he described how you can make measurements of the moon at various phases. So, I was immediately hooked, and even though I can be a lazy astronomer wannabe, I was determined to make a month's worth of lunar observations, even though it might mean staying up quite late or getting up early in the morning to make all of the measurements.
It is here that I make a choice to defer showing the graph of all the collected lunar measurement data points until at the end of this blog post. If you want to get a sense of what the data looks like, then just scroll down to the bottom and then come back up to here again to see all of the details.
The screenshot below repeats Bob's discussion of the phases of the moon and how measurements of the moon's diameter and the width of the crescent can tell us a lot about the nature of the moon's orbit.
 |
| Lunar phase measurements use diameter and crescent width (Source: Bob Buchheim) |
So, after getting this encouragement, we will make lunar measurements over the next month and record the lunar diameter (D) and the width of the crescent (d) and calculate the ratio phi = d/D. All measurements were made with a DSLR with 300 mm telephoto lens. The first data point was taken from the lunar image of October 21, where D = 613 pixels and d = 201 pixels. All of the remaining measurements were made with the same camera and lens focal length setting.
 |
| First lunar measurement data point of October 21 (Source: Palmia Observatory) |
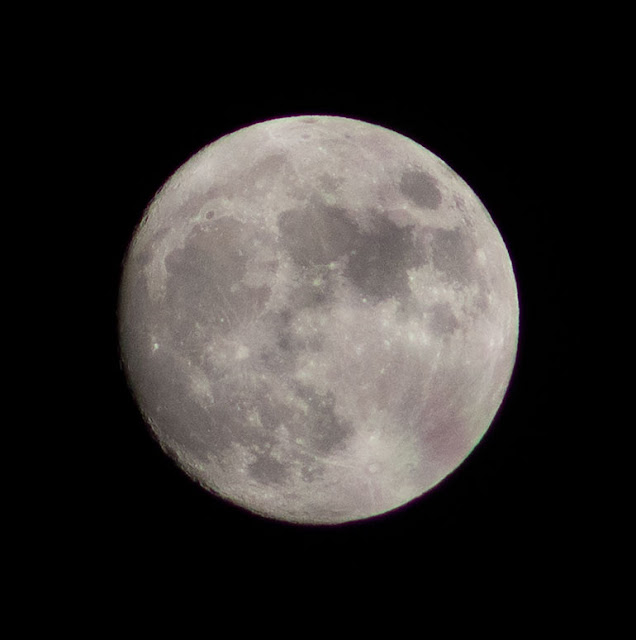
Well, no sooner that we got started, we were clouded out on three nights from October 23-25. Good measurements were made from that time onward. After several more daily measurements, we finally reached the time for the full moon, which we see here in this lunar image of the full moon on November 1.
 |
| Full moon image of November 1 (Source: Palmia Observatory) |
Now we have to go into some of the details regarding the time of day to take the images. When we started the data collection it was easy to adjust the time of taking the images so that the moon was at about the same elevation, even though the time was steadily increasing and getting later and later. We know that this is due to the motion of the moon in its orbit.
Also, the apparent diameter of the moon changes over the month due to several effects. First the orbit of the moon is not circular, but is an ellipse and the moon will vary over the orbital period of a month. The eccentricity of the orbit causes a 14% apparent change in the lunar diameter. In addition, there is an effect depending on whether the moon is high overhead or viewed near the horizon. This effect can make a measurement appear larger when the moon is high overhead because at that time the moon is closer to the Earth by essentially the radius of the Earth. So, for average lunar distance of say, 240,000 miles, the distance can vary by about 4,000 / 240,000, which is about 1.7%, which also affects the moon's measured size. Both of these effects are real, not like the optical illusion that occurs when the moon is near the horizon and our visual system erroneously interprets the moon as being larger.
So, even though it was desired to take the images at the same elevation, after the full moon, it was not easy, at least for this lazy astronomer wannabe, to stay awake late at night to maintain taking images at about the same elevation. So, the time of measurement was switched to early morning.
Photographing the moon from horizon to horizon can result in the images appearing differently due to the field rotation effect. Deep sky photographers compensate for this effect by using polar mounts for telescopes and cameras. But, for me, with just a flimsy alt/Az tripod with camera attached, field rotation will shift the appearance of the moon and can cause errors when trying to monitor diameter and width of the crescent.
You can see the effect of field rotation in the following two images of the moon taken at different times. Both images were taken with the camera frame horizontal to the ground. Note how the location of the large crater, Tycho, has shifted its apparent location.
 |
| Field rotation of lunar images. Left at 7:18 am, Right at 10:11 pm (Source: Palmia Observatory) |
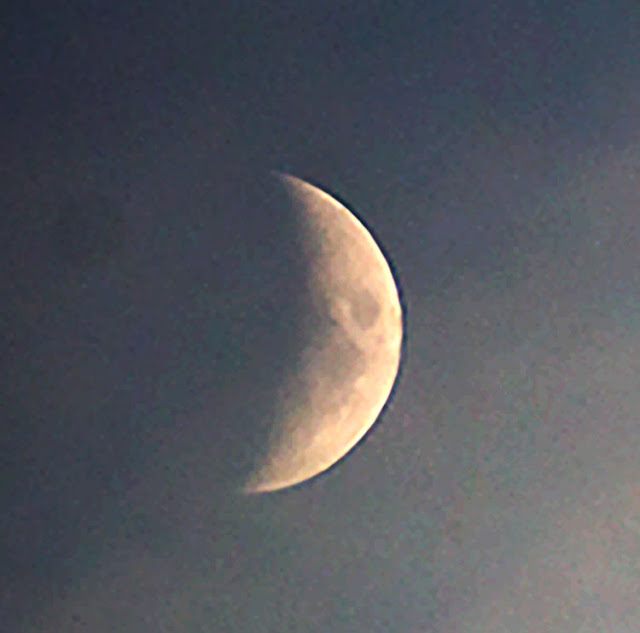
The next set of images, until the new moon, were all taken early in the morning. November 6 observing was clouded out. The crescent just kept getting smaller and smaller as seen in this image from November 9.
 |
| Lunar image (IMG4889) from November 9 (Source: Palmia Observatory) |
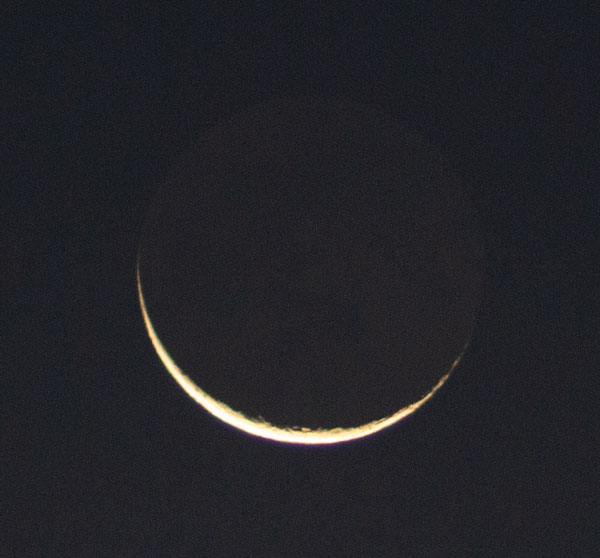
Each day the moon gets closer to being a new moon and the width of the crescent keeps shrinking. In this example photograph you can see a very thin crescent.
 |
| Lunar image (IMG4896) from November 12, just before new moon (Source: Palmia Observatory) |
Oh, oh, the new moon has finally arrived and the moon and the sun rise pretty near the same time and the sky was too bright to see anything and the moon was in silhouette anyway. Nonetheless, I found a nearby hill that offered distant views closer to the horizon, but as you can see the sky was getting too bright. After the new moon, it was easier to photograph the moon in the late afternoon and it wasn't necessary for the lazy astronomer wannabe to set the alarm clock. Great!
 |
| Making a measurement at new moon (Nov 13) is next to impossible (Source: Palmia Observatory) |
Now, you haven't seen any of the measured data displayed on a chart yet, but I was able to see the expected variation in the apparent size of the moon. Now the apparent size occurs because the moon is actually closer to us in its elliptical orbit. So, it was quite interesting to hear on the morning news that the OC coastline was subject to King Tides, which cause a lot of concern for people living very close to the beach. At that time the gravitational effects of the moon are the greatest and tides are much affected during this time. Here is a screenshot of the local news on the TV. When you check out the plot of lunar diameter and see that it is the largest, which means it is the closest, you can see effect.
 |
| KTLA 5's newscast: King's Tides occur when Moon is closest to Earth (Source: Palmia Observatory) |
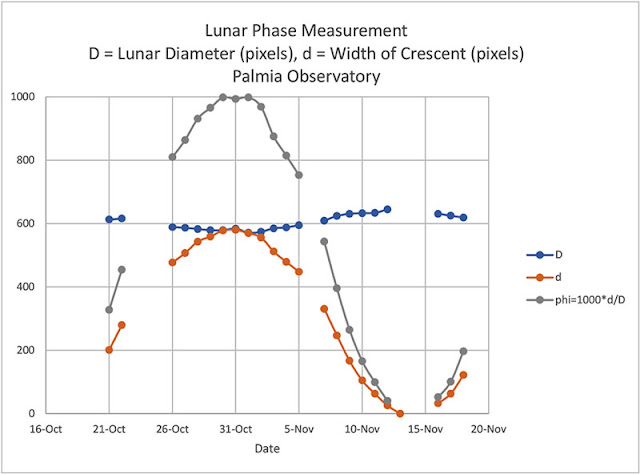
Ok, so we finally have got to the point where a whole month of lunar measurements have been made. This chart shows the summary measurements made from October 13 through November 18. Three days of data are missing due to cloudy skies and one day for the new moon is also missing. But you can sure see how the waxing and waning of the moon sure follows a sinusoidal curve. Pretty neat; and all of which can be done right from your backyard!
 |
| Lunar measurements from October 21 to November 18 (Source: Palmia Observatory) |
So, in this chart we see a months worth of lunar measurements. Some days are missing because of clouds and some days are missing due to the new moon. We see that the phase of the moon follows a sinusoidal pattern as it goes from partial moon to full moon to new moon and back again. We also see that the measured diameter of the moon also follows roughly a sinusoidal pattern, as the moon traverses the Earth in an elliptical orbit, with the mean value around a value of 600 pixels.
The image below is the last image of this sequence of lunar measurements. It took some effort for this lazy astronomer wannabe, but it was done and if truth be told it only took about 5 minutes for each measurement, even if they were done at all hours of the day! So, it is the case, just as Bob Buchheim encouraged us, we can make astronomical measurements from our backyards!
 |
| Last of the lunar measurements, Nov 18, DSLR, 300mm, 1/60 second (Source: Palmia Observatory) |
Until next time, here from our burrow, stay safe, as we recover more of our freedom,

No comments:
Post a Comment