Well I am just getting into the 3rd section of Sean Carroll's "Something Deeply Hidden", where he talks about the emergence of spacetime from quantum entanglement, so we have to pause and let that ferment until next time, but for now let's comment on Lunar Exploration, Solar sunspot and orbital effects, ASASSN surveys and search for gravitational waves from core collapse supernova.
First up is the Distinctive Voices lecture series at the Beckman Center presented "Human Lunar Exploration -- Are We Planning to Stay" by Wanda Sigur, NAE member, Aeronautics and Space Engineering Board. So, I am much interested in this topic and met up there with Big Oil Chemist, Arnold, and Science Nerds & Theatre Impresarios, Scott and Sandy, and Has Telescope Still Packed in the Garage, Frank. Good to see everyone there!
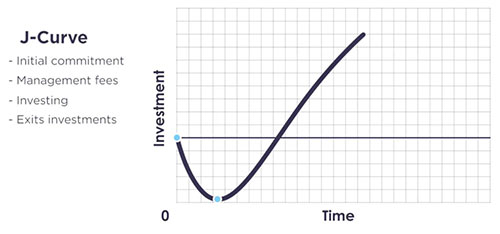
She presented mostly a programmatic review of the 50 years since the Apollo missions and what it will take to go back to the moon and how we might have a more permanent place there. I was hopping for a more visionary, exciting view of the future of living and working on the Moon, but that did not really happen for me. One topic that I especially liked was the discussion about how the initial thrust to the moon was driven mostly by a cold war goal of keeping up with the Russians and the scientific curiosity of what the moon was like. Now, it seems we are transitioning to a more economics based goal and government and commercial partnerships. Now explorers interested in going to the moon hope to have the missions there pay back the huge investment in developing how to get to the moon and live there. This concept is illustrated by the J-Curve, see below, which shows how an initial investment is expected overtime to generate sufficient revenue to pay back the initial expenditure plus more. So the goal is to find ways of exploring the moon and conducting services there or making products there that are economical to Earthlings. It is almost like the cold war is over and a different vision is necessary now to maintain the huge space exploration costs of going back to the moon.
 |
| J-Curve shows cash flow from initial investment to payback period (Source: Steve Balaban, U. of Waterloo) |
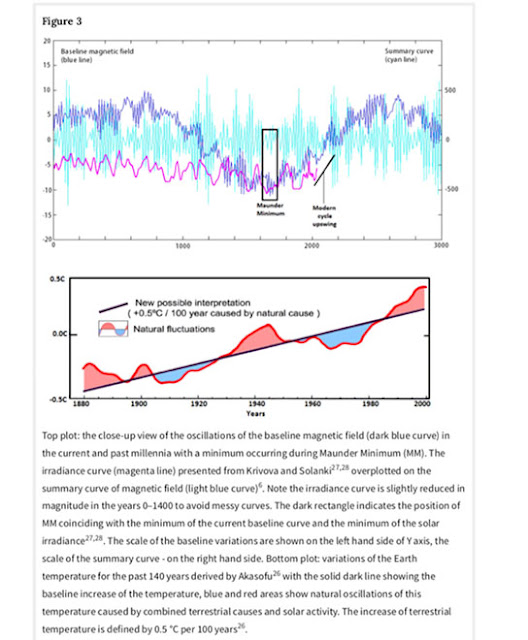
Next, let's take a look at some of the ongoing research in trying to understand the solar sunspot cycle and put it on a better understood theoretical basis, not just a statistical time series of the 11 year cycle. I have seen many papers recently where maybe a dozen scientific teams keep trying to better understand the 11 year solar sunspot cycle, but I had missed this paper until Has Telescope Still Packed in the Garage, Frank, alerted me to it. This Nature paper is by Professor V. Zharkova and team who have analyzed the magnetic field time series of measurement and developed correlations that pretty much still match the historical record and yet predict more warming from the sun in the future. I didn't see this an argument against current greenhouse warming scenarios, but it might indicate that the warming could be even worse in the future. We will have to wait and see what the other sunspot cycle teams report because it seems mostly about curve fitting more than fundamental physics.
 |
| Fitting solar magnetic field to historic time series (V. Zharkova, et al, Nature, 24 June 2019) |
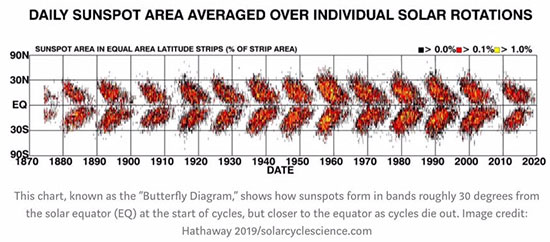
This is probably a good time to review what observations of the sunspot cycle looks like and also review some of the Earth's orbital variations, now called Milankovitch cycles, and their effects on solar insolation. First for the sunspots, you can see in the diagram below that the 11 year cycle goes from minimal sunspots to maximum number of sunspots and then repeats. The interesting thing in these "butterfly" diagrams is how the sunspot seem to appear at mostly the same solar latitudes and then move toward the equator as the solar cycle moves on. What is going on with that and what does it tell us about the underlying physics of the sun?
We should also review how the orbit of the Earth and its variations around the sun also impacts the amount of solar insolation that strikes the Earth. The temperature of the Earth, as is the case for every other planet, is a heat balance between incoming radiation and outgoing radiation. If the two are in balance, the temperature stays the same, and if more radiation comes in the temperature goes up. Of course it gets more complicated by the amount of land and the amount of clouds and other details but that is the main issue. Now there are three main parameters of the Earth's orbit that can affect the amount of solar radiation striking the Earth. There are also much longer period orbital variation associated with the movement of our solar system around the Milky Way galactic center, but these are not list here. (See Lisa Randall's book on some possible issue with that motion). These three parameters are shown in the figure below: Eccentricity, Obliquity/Tilt and Precession.
 |
 |
| Total solar insolation is the sum of three long term orbital cycles (Source: Wikimedia Commons) |
As a final comment about the sun, consider this photo taken from the lunar surface by Apollo 12 crew. The sun as viewed from the moon or outside of our atmosphere is that of a large white star. The yellow sun that we see from Earth is due to seeing the sun through the atmosphere.
 |
| Sun, photographed from lunar surface is white, not yellow (Source: NASA Apollo 12) |
Finally, we can add some additional comments regarding the search for gravitational waves from core collapse supernova. Recall that in the last post of September 24, 2019, Dr. Kanner discussed how his Caltech group, and others, are trying to identify gravitational waves which should be produced by asymmetric core collapse supernovae. Their approach was to first identify those core collapse supernovae, which were close enough to be detected by LIGO, and which happened to occur during the LIGO observing runs. How do you first of all know where these supernova are? Well, one method is to use the All-Sky Automated Survey for Supernova (ASAS-SN) coordinated by Ohio State University.
In the photo below you can see the 1000 supernovae detected and reported by ASAS-SN in the last 6 years of operation. You can also see that the detections are arranged mainly into two groups: Type 1a, which are associated with binary star systems, and Type II, which are associated with core collapse supernovae. The network of telescopes then alerts other members of the astronomical community so that other observatories can be brought to bear on the new detection. The detected supernovae seem to be pretty much uniformly distributed across the sky as seen by the background looking toward the center of the Milky Way.
 |
| Location of the 1000 supernovas detected by ASAS-SSN (Source: SuperASASSN) |
So, Dr. Kanner and the rest of the LIGO community can use ASAS-SN alerts to go back over the collected LIGO data and see if they can find any associated gravitational wave event at that time. The detected LIGO signal would be quite different from the inspiral of the two stars of a binary system, but is still considered to be detectable by LIGO. The chart below, taken from one of the LIGO Collaboration papers detailing the search of these gravity waves, shows the five targeted core collapse supernovae which were reported during the same time that LIGO was collecting gravitational wave data. The targets were all less than 20 Mpc away, which is sort of close by, in an astronomical sense of distance. Remember that the Andromeda Galaxy is just less than 1 Mpc away from us.
 |
| Looking for gravitational waves from nearby core collapse supernovas (Source: LIGO Collab., arXiv:1908.03584v3, 2019) |
You can check out the referenced paper for the details but the analysis reported there is that they could not make any credible correlation between the optically observed supernovae and any detected gravitational waves. Additional upcoming observations might eventually show the gravitational wave details associated with a core collapse supernova. Also since this type of event would likely not include any type of inspiral, we need to get a better picture of what a possible gravitational wave event from a core collapse supernova would look like.
Finally, I have had a chance to review some of the LIGO tutorials that are available for interested physicist wannabes or citizen scientists. Let us look at just one of the slides from the video tutorials on how the mass of a merging binary star system can be determined. There are more technical details available going over the analysis, etc., but this one slide shows examples of how the signal would differ for different masses of binary star systems. Note also how the final mass of the merger, even though much of the mass of the incoming binaries can be shed and thrown out of the system, can be determined by the ringdown signal, which is directly caused by the mass of the resulting black hole. There are many other tutorials available so be sure to check them out if this type of astrophysics if of interest.
 | |
|
Until next time,
Resident Astronomer George
Be sure to check out over 300 other blog posts on similar topics
If you are interested in things astronomical or in astrophysics and cosmology
Check out this blog at www.palmiaobservatory.com


No comments:
Post a Comment