Well this week again we had no outside astronomical observing, except to see and enjoy the bight full moon on Friday 13th. Did you get scared? Ok, ok lets instead review some astronomical spectroscopy details for radial velocity measurements and some other comments.
But before getting into radial velocity we should share a very informative paragraph from Sean Carroll's latest "Something Deeply Hidden." Last post we discussed some of the quantum mechanical aspects of MultiWorlds, but finally I read a rebuttal of what I had always assumed about MultiWorlds and that was that it implied that more mass and energy were being created at each wavefunction branch and this idea was I considered outside of belief. Now after reading more of the book, I find that energy conservation is already a natural part of MultiWorlds theory. Total energy is not increased as the wavefunction branches! Wow, thanks for that illumination, Sean!
Let us take a look now at a few of the paragraphs illustrating the nature of energy conservation as found in MultiWorlds. In this set of paragraphs, Sean imagines a conversation between older physicist father, who is learned and steeped in the Copenhagen interpretation and his younger physicist daughter, who is learned and steeped in MultiWorlds. In addition, the dialog has the father sipping on a martini. Now, I see that the quantum branch that this version of myself is on includes a superposition and entanglement of physics and martinis. Nice!
 |
| Energy conservation and MultiWorlds fit together nicely (Source: S. Carroll, "Something Deeply Hidden") |
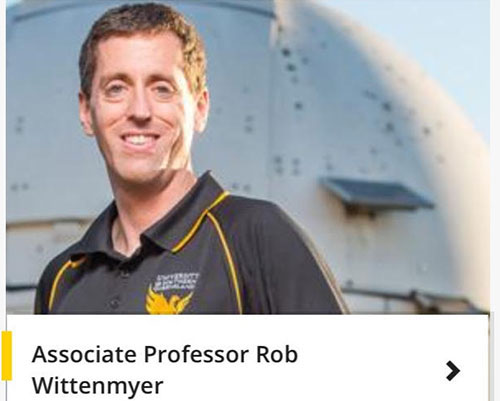
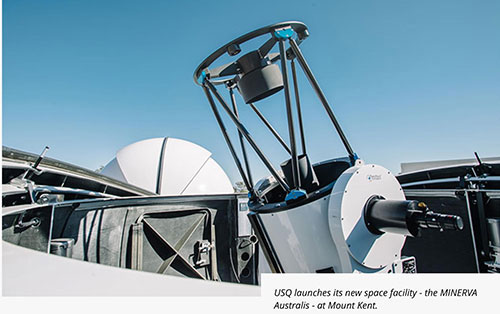
Now back to the topic of radial velocity measurement as a technique to find and identify exoplanets came up at this time because of an UCI Astrophysics seminar by Professor Rob Wittenmyer, University of Southern Queensland (Australia). I met up there with Gravity Guy & Part-time Las Vegan, and with Science Nerd and Theatre Impresario, Scott. We sat in on the seminar and then had discussion on radiation effects on astronauts making a journey to Mars, but more about that later. Professor Wittenmyer is an animated speaker and he let us in on making follow up of possible planets found with the Transiting Exoplanet Survey Satellite (TESS) using his just installed set of telescopes at the Mount Kent Observatory. He found that major observatories don't have enough observing time that can be allocated to TESS follow up. So, he went about getting independent funding to build an observatory where all of the time could be allocated to TESS exoplanet follow up studies. This new observatory setup is called MINERVA-Australis, which stands for the Australian version of Miniature Exoplanet Radial Velocity Array, and is a follow up on the initial trials at Mt. Hopkins in Arizona.
 |
| Associate Professor Rob Wittenmyer, USQ (Source: USQ) |
So, if you are going to build your own observatory, there are some tradeoffs between cost and aperture size. Wittenmyer found that using an array of smaller telescopes was more cost effective approach for this type of study. Check out the graph below where you can see the large jump in cost of single telescopes with apertures greater than one meter, but that an array of smaller 0.7 meter telescopes, which are available as factory made units, can be a more cost effective solution.
 |
| Economics of MINVA - Australis Telescope Selection (Source: R. Wittenmyer, et al, arXiv:1806.09282) |
The photo below shows one of the 0.7 meter telescopes and mount.
 |
| One of four 70-cm Planewave Telescopes at Mount Kent Observatory (Source: MINERVA - Australis) |
Selecting the telescope is just the first part of putting together a TESS follow up system. The method used is the radial velocity method where the wobble of the star, caused by the orbiting exoplanet, which can be measured by the doppler shift in light from the star. This method does not rely on observing the exoplanet, only the wobble in the spectra from the brighter star. In the drawing below you can see how the spectra of the observed star shifts back and forth from redshifted to blue shifted as a result of the gravitational attraction with the exoplanet. Both star and exoplanet orbit around the common center of mass, outlined here as the grey dot.
 |
| The motion of a planet causes the star to wobble about the common center of gravity (Source: Las Cumbres Observatory) |
Before getting into what values of radial velocity are expected to be observed, let's comment briefly on the Las Cumbres Observatory. I didn't really know much about this observatory, but a little internet search reveals that the observatory is headquartered in Goleta, CA, and was founded by philanthropist Wayne Rosing in 2005. The telescopes, two 2-meter, 2nine 1-meter, and seven 0.4-meter, are located in both the southern and northern hemisphere and are mostly remotely operated as a network. Pretty neat! If you want to learn more about Las Cumbres, check out their webpage or Wikipedia to start: https://en.wikipedia.org/wiki/Las_Cumbres_Observatory
Ok, back now to what value of radial velocity for exoplanets is expected as they orbit and disturb their home star. The table below shows what radial velocities would be observed for planets in our own solar system. For Jupiter size planets, around our size of star, the radial velocity is 28.4 m/sec if the planet were located at 1 AU, but only 12.7 m/sec if in its actual position at 5 AU. To detect an Earth size exoplanet the radial velocity is a very low 0.09 meters/sec. Wow, now we see why up till now it has mostly been the larger Jupiter size exoplanets that can be easily observed with the radial velocity method.
 |
| To detect Earth size exoplanets you need to resolve 1 meter/sec radial velocities (Source: Wikipedia) |
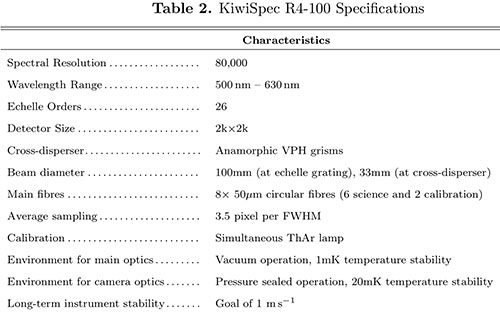
But what actual observing capabilities are now available. The sensitivity and ability to measure the very small Doppler shifts associated with these low radial velocities is all dependent on the quality of the astronomical spectrometer. The spectrometer selected for the MINERVA - Australis telescope array is outlined in the table below. Note that it has a design goal of 1 meter/second. Hmm, so the observing capability is more in line with Super Earths or regular sized Earths in much closer orbits. We see to that these observations have to compensate for the velocity of the Earth in orbit around the sun because the relative velocity is in the same ballpark range. You don't want to misinterpret the measurements where the observers velocity is in the same approximate range of the target exoplanet.
 |
| MINERVA - Australis Spectrometer specification to measure RV of 1 m/sec (Source: B. Addison, et al, arXiv:1901.11231v2) |
Hey wait a minute, let's look at that spectrometer design requirements table again. It lists the spectral resolution factor R = 80,000. That by itself is no where near large enough to achieve 1 meter/sec Doppler shift in the observed spectra. Recall that R is defined as the observed wavelength divided b the narrowest range between two wavelengths that can be resolved. So if you are observing at say 500 nm, then the smallest difference between two observed wavelengths would be 500 / 80000 = 0.00625 nm. That is pretty impressive, but to see that it is not sufficient we should look now at what Doppler shift, associated with 1 meter/second, is expected. Recall that Doppler shift in wavelength scales as the speed of the target divided by the speed of light. So to required spectral resolution is somewhere more in the neighborhood of R = 300,000,000. Hmm, so this is not going to work, but we need to carefully review the spectrometer specification table and finally notice that an Echelle spectrometer with Echelle Orders of up to 26 are built into the design. If I remember correctly the actual spectral resolution capability is effectively the product, 26 * R = 2,080,00. Hmm, that is better but still doesn't look like even that is enough. I'm missing some key understanding of the physics!
But what is going in inside an Echelle Spectrometer? To dig a little deeper into that topic, we need some more information on spectrometer design. There must be something else going on or some other principle that I am forgetting about. It is easy for me to deal with just simple spectrometer designs, since the spectrometer we have here at the observatory only has R = 600, or thereabouts.
Ok, we might not be able to resolve what is going on here, but let's consult a pretty good textbook, "Optical Astronomical Spectroscopy" by C.R. Kitchin.
 |
| Pretty decent textbook on astronomical spectroscopy (Source: C Kitchin, "Optical Astronomical Spectroscopy") |
So, the first thing to understand is what is the optical path in an Echelle spectrometer. In the diagram below you can see how the optical path includes an Echelle grating which is then followed by a cross disperser. The net result is that the spectrum is now arranged as a two dimensional image rather than just a line that we are used to seeing.
 | |
|
An example of a 2-dimensional spectrum is illustrated below. You can see lines of spectra and you get wide range of wavelengths and at the same time higher resolution. Pretty neat!
In one of Ken's AIAA presentation he argued for the use of lightweight polyethylene pellets for shielding, as mentioned in our post of August 25, 2019. Another approach which an audience member suggested to Ken was the use of artificial magnetic fields carried along the spacecraft. When I first heard of the use of magnetic fields, I said "no way is the field going to be strong enough." So, as part of my homework I did a back of the envelope calculation and found that for low speed particles like protons, travelling at say one million meters per second, that a one Tesla magnetic field would deflect the proton by about 40 meters by the time the proton travel through 1 meter of the field. Dang, it might be possible after all to use spacecraft generated magnetic fields!
So, after our discussion in the parking lot, Ken received some more information on magnetic shielding. It seems that to do a magnetic active shield you first need to consider the energy spectra associated with solar radiation and cosmic ray acceleration. The incoming particles are travelling at a very wide range of energies (velocities) and the effectiveness is not as great as I had calculated. One approach of an active magnetic field is shown below. Note that the field design is such that the astronauts inside the spacecraft see zero magnetic field and would not be affected by it. Hmm, very interesting and we can see that more study by the experts is going to be needed. Thanks for the great discussion, Ken and Scott!
 |
Magnetic shielding of space capsule (R. Battiston, et al, "Active Radiation Shield for Space Exploration Missions")
|
Until next time,
Resident Astronomer George
Be sure to check out over 300 other blog posts on similar topics
If you are interested in things astronomical or in astrophysics and cosmology
Check out this blog at www.palmiaobservatory.com


Just thought I'd answer your well considered question about "R" and the impact on velocity precision:
ReplyDeleteWith a resolution (for example) of R=100,000 it is indeed true that the "width" of a single feature is of the order of 300 m/s. However, with reasonable S/N and decent pixel sampling the centroid of a single feature can be found to much better precision than this. Let's say 100 m/s. Now, consider that an echelle spectrum of a star has some 100 orders each with some 500 "features" (i.e., absorption lines) then a single spectrum can provide some 50,000 measurements of the centroid of these features. The error of these measurements sums in quadrature. So, the final precision is of the order of 100[m/s]/sqrt(50,000) ~ 1 m/s.
Hope this helps.