Greetings from Palmia Observatory
Well have more comments on the 237th AAS meeting, but first we have some DSLR images of the Moon-Mars-Uranus conjunction.
Capturing the bright moon and Mars and even dimmer Uranus is a challenge. This image is just a one shot image that overexposes the moon while barely capturing Mars, not to mention missing poor Uranus, which should be positioned between Moon and Mars.
 |
| Crescent Moon and (barely visible) Mars in DSLR, 150mm, 1/60 second (Source: Palmia Observatory) |
Some enterprising photographers will combine different images using different exposure settings to generate a composite image showing more beautiful detail, but that is not the course of this lazy astronomer. If we just focus on the conjunction of Mars and Uranus, we can use longer exposures and see both planets. Of course, again here there will be many other photographers who will use higher resolution and focal length to get more planetary detail.
 |
| Mars and Uranus (far left, middle) in DSLR image, 600mm, 1 second (Source: Palmia Observatory) |
As you can see, I was quite lucky to just barely get Uranus in the same frame as Mars with the 600m lens I should have positioned Mars further to the right in the camera frame. Nonetheless, the measured angular separation between Mars and Uranus was 1.67 degrees. The calculated value for the separation based on elevation and azimuth predictions from GoSkyWatch app showed 1.61 degrees separation. Pretty good agreement for quick eyeball measurement of distances in Photoshop. When you calculate the angular separation using database values, you need to correct for the distortion in azimuth distance by using the cosine of the elevation.
Astronomer Assistant Ruby considered a homework quiz in photo analysis using the tire tracks she found on her daily walk. So, here is the quiz. Using the pocket knife length of 3-3/4 inches, as a distance standard, estimate the following:
- From the measured distances, estimate the diameter of the automobile tire
- From the measured distances, estimate the width of the puddle that wetted the tire
- Explain your assumptions about the effect of the camera not being strictly vertical
 |
| Image analysis with Astronomer Assistant Ruby (Source: Palmia Observatory) |
Ok, while you put the quiz on your schedule of events, besides what else have you got going on, let's return to some more comments about the recent 237th AAS meeting. First up, it was neat to see that there was a special zoom, meet and greet session for AAS Affiliate Members, which includes a lot of amateur astronomers. Here you can see some of the affiliate members and you might even notice one of OCA's former secretaries, Bob Buchheim. I think that Bob is a professional AAS member, given that he has authored several books on astronomy for amateurs. Anyway, it just shows that the AAS, in recognition of valuable observation support and other values, like discovery of supernovas, is trying to include amateurs more in the organization. Pretty neat, so for all of you interested amateurs, check out the details and take advantage of becoming affiliate members.
 |
| Open zoom meet and greet meeting for AAS Affiliate members (Source: 237th AAS Meeting) |
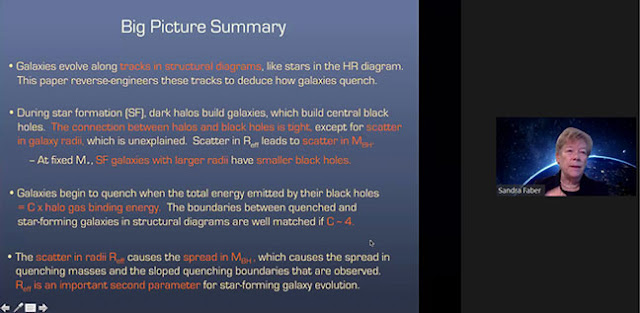
Ok, finally some comments about the AAS meeting. Here we see Sandy Faber's big picture summary slide describing how the structure of galaxies form and evolve. The evolution of galaxies can be placed on a diagram, similar to the H-R diagram for stars. The evolution and formation of galaxies requires better understanding of dark matter and how the central black holes both support and hinder or quench star formation and structure formation.
 |
| Big Picture Summary of Galaxy Structure and Formation (Source: Sandra Faber, AAS 237th meeting) |
Now, I had heard all about the famous Faber-Jackson relationship between galaxy luminosity and the central stellar velocity curves, but had not realized that that Faber was indeed this Faber, Sandra Faber. Pretty neat!
 |
| The Faber-Jackson Relationship between luminosity and central stellar velocities (Source: Wikipedia) |
Sandy Faber went on to describe problems and issues with understanding all of the physical features that explain galaxy formation. I am still amazed every time I see this diagram of what the dark matter halo might look like for a galaxy like the Milky Way. Working out all the details is still a work in progress.
 |
| Illustration of a halo and an embedded galaxy (Source: Sandra Faber, 237th AAS Meeting) |
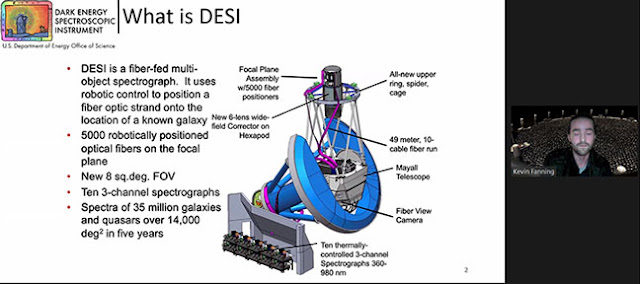
One of the major tools used to investigate the structure and formation of the universe are the large-scale spectroscopic surveys of galaxies. One of these large surveys is the Dark Energy Spectroscopic Instrument (DESI). The survey is conducted using the 4-meter telescope on Kitt Peak.
 |
| What is DESI? (Source: Kevin Fanning, 237th AAS Meeting) |
The DESI can take up to 5,000 simultaneous spectra for any given telescope pointing location. Readers may recall that my recent trip and tour of the Sloan Digital Sky Survey (SDDS) facility at Apache Point, NM, we learned how that galaxy redshift survey there was able to take 640 simultaneous spectra. At the time the SDDS was being conducted, a circular aluminum plate was pre-drilled the night before the planned operation with holes for 640+ fiber optic cables and the fibers were hand stuffed in a holding assembly until it was mounted on the telescope at the focal plane. I still have, as a historical souvenir one of the original aluminum plates with holes drilled for some previous night of observation. Details of that plate can be found at the previous blog posting of January 20, 2019.
The neat feature of the DESI is that the location of the 5,000 optical fibers is set and held in place, not by a pre-drilled plate, but by 5,000 robotic fiber optic cable positioners. So, the position of each fiber can be computer controlled and in just a couple of minutes the position can be changed to adapt to that night's observing schedule. The automation of this new instrument is fantastic. Pretty neat!
 |
| DESI Focal Plane System (Source: Kevin Fanning, 237th AAS Meeting) |
 |
| Nicholus Mayall Telescope on Kitt Peak (Source: Wikipedia) |
In another presentation by Adi Foord, we learned more about how the observation and optical spectroscopy is used for studying AGNs and pair of AGNs. With high resolution spectroscopy you can measure the redshift of spectral lines generated at different parts of the AGN. For instance if you are looking at emissions from one part of the accretion disk that is moving toward the observer, you will see the lines blue shifted and if you happen to be looking at the gas moving away from the observer, the lines will be redshifted. This effect often shows up as double peaked emission lines as shown in the screen capture below.
 |
| Double peaked emission lines from dual AGNs (Source: Adi Foord, 237th AAS Meeting) |
Another method used to study the structure of the universe is the use of gravitational lensing observations. I found this description of how gravitational lensing works. The amount of detection of the light from the background target is determined by the optical path around the lens.
 |
| Measuring gravitational lensing signals (Source: Priyamvada Natarajan, 237th AAS Meeting) |
 |
| Some examples of gravitational lens systems (Source: Priyamvada Natarajan, 237th AAS Meeting) |
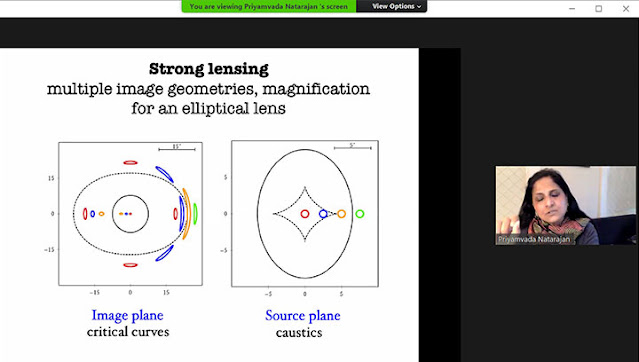
Finally, let's conclude with a final screenshot that shows examples of how different lensed images are formed depending on the location of the object and where it is located near the caustic curve. The caustic is a curve which represents the mathematical impact of the massive lens on light rays that pass near the lens. Now I see how the calculation of the caustic curve is a key part in doing the analysis of the lensed image or as we see multiple images.
 |
| Illustration of how multiple lensed images occur (Source: Priyamvada Natarajan, 237th AAS Meeting) |
Until next time, here from our burrow, stay safe, as we recover more of our freedom,

No comments:
Post a Comment