Greetings from Palmia Observatory
This week we provide a technical discussion of spectroscopy as one of the fundamental tools of astrophysics and then review how amateurs can use modern diffraction gratings to make wavelength measurements of light from celestial objects.
Why do we care about and use spectroscopy and use it in our study of astrophysics and cosmology? This screenshot from a NASA site tells us of the type so information we learn from analyzing the spectral light we get from celestial objects.
 |
| Spectroscopy is a fundamental tools that tells much about the universe (Source: imagine.gsfc.nasa.gov) |
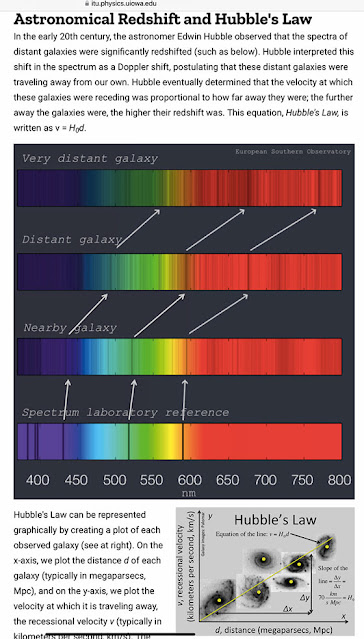
One of the most important observations that we make is the redshift of galaxies. This next screenshot shows how the observed spectra, created by supposed quantum mechanics transitions of elements found in the galaxy, are shifted according to the velocity of the observed galaxy. The red shift can be caused by the galactic velocity or because of the expansion of spacetime between us and the observed galaxy. This forms the basis of Hubble's Law.
 |
| Spectroscopy identifies redshift of distant galaxies (Source: itu.physics.uiowa.edu) |
The measured redshift for distant galaxies identifies the expansion of the universe. We also use the redshift to identify the velocity of gas and dust in and between galaxies. The doppler shift tells us if the gas is coming towards us or moving away from us. We also can get estimates of the density of the object compared to the previous time.
 |
| Measured redshift identifies expansion and mass density (Source: hyperphysics-phy-astr.gsu.edu) |
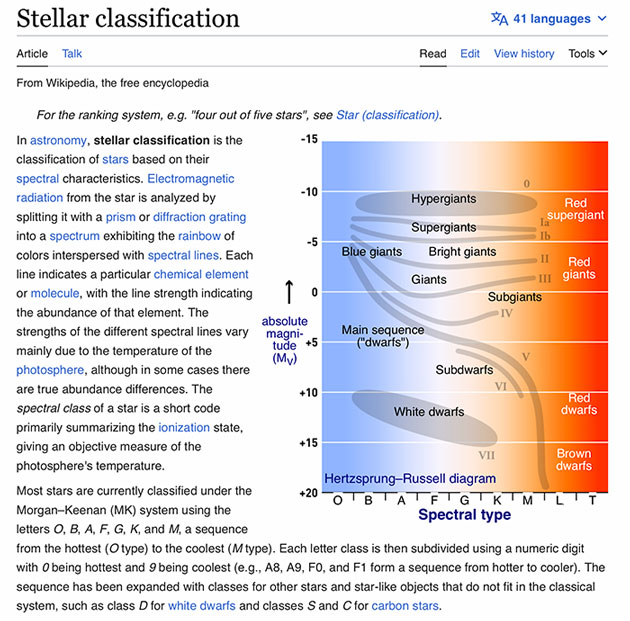
When we consider the wide variety of stars that we see in the night sky, we recall that plotting all of these stars on the Hertzsprung Russell Diagram we can identify how the stars fall into classes with different characteristics.
 |
| Stellar Classifications (Source: Wikipedia) |
The spectral types (O, B... M) each correspond to a particular temperature.
 |
| Spectral types or color represent temperature (Source: astroprinceton.edu) |
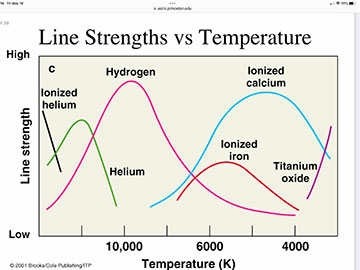
In addition to measuring the wavelength we see that the line strength tells use information about how many optical transitions are occurring at the measured wavelength.
 |
| Line Strengths versus temperature for some elements (Source: astro.princeton.edu) |
All astronomical observation of spectra is based on the assumption that the quantum mechanical basis of emission and absorption of atoms, like hydrogen, are the same as here observed on Earth and we can rely on this assumption when observing spectra from distant objects and any observed differences are due to the velocity or expansion of space or in some instances the different magnetic fields. In this screenshot we see that the most important transitions for hydrogen are the Balmer series, which occur in the visible spectrum.
 |
| Physical atoms and emission/absorption lines are discrete (Source: Wikipedia) |
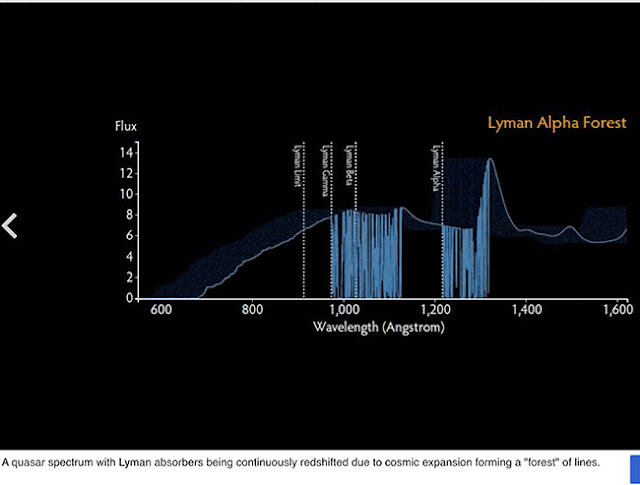
Most of this blog post will deal with spectroscopy from the Balmer line series of hydrogen and other transitions from elements found in stars, etc., but a very significant tool for measuring the cosmic expansion and monitoring the Interstellar Medium (ISM) comes from the Lyman Alpha transition lines of hydrogen. Of particular importance is the first Lyman line occurring at 121.6 nm. Note how in this screenshot the 121.6 nm line is shown being redshifted to longer wavelengths due to cosmic expansion. Tracking the Alpha Forest is a great tool for exploring the ISM and cosmic expansion. This important topic is not discussed further in this post.
 |
| Lyman Alpha Forest due to cosmic expansion (Source: Wikipedia) |
Back in the world of Balmer line observations we see more details available about starts from the observed spectra. Some of the typical spectral lines observed in star are shown in the screenshot below.
 |
| Spectral Classification of Stars and elements present (Source: astro.princeton.edu) |
The observed spectra of stars is a combination of quantum transitions from deep within the star and how these and other transitions are modified by the cooler outer stellar atmosphere. Note because of many factors, including the random motion of all of the atoms in the stellar atmosphere we see a continuous spectrum in addition to various spectral lines.
 |
| The Balmer lines of hydrogen show up in the visible region (Source: astro.princeton.edu) |
So we see that the spectral lines are generated by quantum mechanical transitions at the source and their wavelengths are modified by the velocity and expansion of space between then and now when the lines are observed. For us earthbound observers we need to make sure that the atmosphere is transparent to the wavelengths of concern.
This screenshot shows the atmosphere being transparent to optical wavelengths and some radio wavelengths but not so much transparent to infrared wavelengths. This is why satellite observatories are more appropriate for many wavelengths. Luckily, a lot of amateur spectroscopy is done in the visible wavelengths.
 |
| The opacity of the Earth's atmosphere limits observations (Source: ipac, icc.dur.ac.uk) |
Ground based survey telescopes like the Sloan Digital Sky Survey (SDSS) located in Apache Point, NM, can take up to 640 individual spectra of galaxies in each sky location that it is pointing at. This used aluminum disk was used once for the sky location and then ultimately the disk, one of hundreds, was given away to interested attendees at an AAS meeting. A separate fiber optic cable would be placed in each hole and connected to the multi-inputs of the spectrometer.
 |
| Sloan Digital Sky Survey disks enable 640 spectra simultaneously (Source: Palmia Observatory) |
Resident Astronomer George visited the SSDS observatory in Apache Junction, NM, way back in October 2019 as part of a group tour sponsored by the AAVSO. You can check out the details of that visit at the blog post: http://www.palmiaobservatory.com/2019/10/aavso-108th-meeting-concluded-hooray.html
The James Webb Space Telescope (JWST) can also collect the spectra from 100 different individual objects at the same time. The JWST is also in space and not subject to the transparency or opacity of the atmosphere.
 |
| The JWST is designed for observing spectra in the infrared (Source: www.webbtelescope.org) |
The spectrograph uses prisms or gratings to separate the incoming light according to the wavelength. High quality spectrographs often use a slit in the optical path to control and limit the source of light entering the spectrograph. Spectrographs with optical slits must be correctly positioned to keep the object aligned with the slit.
 |
| Conceptual configurations of spectrographs (Source: edmondoptics.com) |
Amateur spectroscopy trying to use a slit base spectrometer must have careful telescope alignment and tracking and even guiding to keep the object aligned with the slit. Regardless of whether the spectrometer has a slit or is "slitless" the diffraction grating is used to separate the incoming light according to wavelength. In the screenshot below we see that the incoming white light is reflected and shows up in various locations identified by the order of reflection. The "0 Order" is just the reflection of the original incident light without any separation by wavelength. The "1st Order" is where we start to see separation by wavelength.
 |
| Diffraction gratings spread the light into "0 order and more (Source: edmondoptics.com) |
 |
| Diffraction and wavelength and grating order (Source: www.brainkart.com) |
In our next blog posting we will look at some actual spectral images taken with the SA-100 diffraction grating tool and see how we use diffraction theory to identify the wavelength and intensity of the light.
Until next time,

No comments:
Post a Comment