This post covers how the attenuation of solar eclipse glasses can be measured and also, how the weather finally cooperated and some additional measurements of the movement of Polaris were found. Additionally, a couple of lessons learned about planning for the upcoming eclipse travel are presented.
Ok, first a couple of lessons learned this week.
Lesson Learned: Hey, we are going to travel to a dark sky site and all previous planning was how to take a couple of pictures during the eclipse. I had forgot about the available dark skies and wondered if not taking a scope was a missed opportunity. Maybe we should have driven there and taken a lot more equipment? Anyway, I decided to compromise and just take an additional camera lens (18-55 mm) so that I can capture some big sky objects like constellations and the Milky Way against the Wyoming background. Resident Astronomer Peggy will be taking her big binoculars. So, be sure to update your travel plans by last minute recognition of where you are going!
Lesson Learned: Hey, one of my camera batteries is dead and won't take a charge. Luckily, I had time to order a couple more batteries. So, check all your batteries and make sure you are good and pack your charger. We will probably be observing the sun for 4-5 hours, so now is the time to check it out. I hope that carrying spare camera lithium ion batteries is allowed for airline travel?
Ok, back to measuring the attenuation of solar eclipse glasses. This question was brought to my attention by Math Whiz, Dave, who found his old pair of glasses and used the brightest light around to verify that no light was coming through, but how would you actually measure how much light is blocked by the glasses. Thanks for that discussion, Dave!
So, how should we go about measuring the attenuation for the typical solar eclipse viewing glasses? Well, we are not in the quality control business so we are not going to use some laboratory equipment to make the measurement, but will use some of our astronomical sources and equipment to make the measurement.
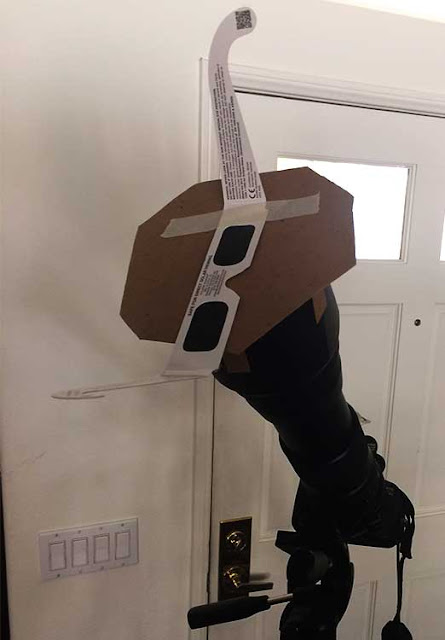
Well, I elected to just use the glasses as a filter and measure the amount of light through the glasses and compare that to a know standard. The setup begins as shown below with the glasses just taped to a cardboard aperture. The aperture is just a bit smaller than the individual lens and ensures that the amount of light collected by the lens is fixed. Then when the same lens is used to monitor the known light standard, in this case, the moon, then it is the aperture which ensures the two separate measurements can be compared. By the way if you need some stiff cardboard to make your own adaptor, Astronomer Assistant Willow reminds me that the cardboard filler in her 24-can pack of grilled salmon is a great place to start and she is willing to accept the cans in lieu of the cardboard filler!
 |
| Measuring eclipse viewing glass's attenuation using cardboard fixed aperture tool (Source: Palmia Observatory) |
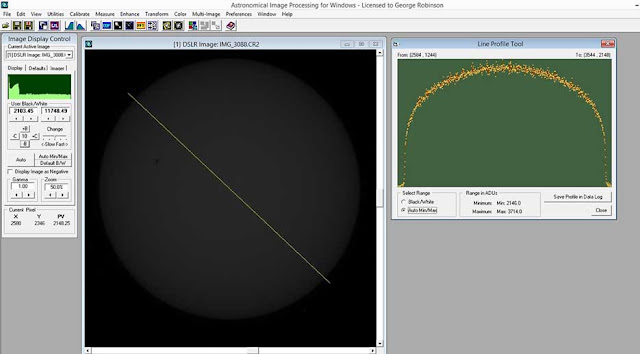
Now, the setup described above is used to observe the sun and the 1/15 second exposure is shown below. The sun is pretty uniformly bright, except that the effects of limb darkening have to be taken into account. You can see in the AIP4WIN screenshot below that for an arbitrary profile line drawn through the sun, the light profile show the effects of limb darkening. To get an estimate of the average amount of light coming from the sun, the average light in camera ADU's is computed along the yellow profile line. The average light flux for this measurement was found to be 671 ADU's, which is reported as if it were a 1/30 second exposure so that the result is comparable to the upcoming 1/30 second exposure for the moon photo.
 |
| Estimating average brightness of sun trough eclipse viewing glasses (Source: Palmia Observatory) |
For the second calibrated source to which we will compare the eclipse glass filtered view of the sun, we chose to use the almost full moon. Hey, who says that you can't make good observations during a full moon?
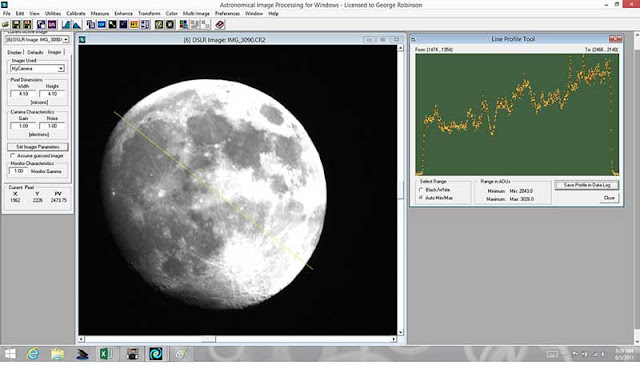
In this case, a profile line was selected that crossed the moon in an arbitrary direction. Not how the line profile in the AIP4WIN screenshot is quite variable, depending on whether the line crosses a bright or dark area on the moon. There is some variability here, but this one profile line was used as the basis of measurement and does represent a source of error in the measurement. Ideally, one would just integrate and average over the entire image of the moon, but I don't know how to do that with the given tools. The average light intensity value in this linear profile case was measured to be 560 camera ADU's.
 |
| Estimating average moon brightness along profile line (Source: Palmia Observatory) |
So now we are ready to complete the estimate for the attenuation provided by this one pair of solar eclipse viewing glasses. This method does not assume anything about the sensitivity of the camera and just uses two relative differences measurements of two different light standards, in this case the sun and the moon. First we adjust the ADU average count for the sun image so that the exposure times between the sun image and the moon image are the same. Then the average light flux from the filtered sun and the unfiltered moon is calculated along a random profile line though the image. Note that the sun is pretty uniform, but you can see the effects of limb darkening at the edges of the solar disk. The background sky is assumed to be 2048 ADU, the bias level of the camera. So our measured data and published magnitudes for the sun and moon include:
m1 = -26.7 (visible magnitude of the sun)
m2 = -12.2 (visible magnitude of the moon)
f1 = 671 *ND (average flux from sun times the solar filter attenuation (to be determined) ND)
f2 = 560 (average from moon through the same aperture used for the sun)
Now from astrophysics and magnitude definition we know,
m1 - m2 = -2.5 * log (f1/f2), so we can solve for the unknown variable, ND
ND = 263,290 or as the Neutral Density is often expressed as the logarithm, so ND = 5.4 in log units
So, we see our best estimate of the attenuation of this particular pair of solar eclipse viewing glasses reduces the amount of light from the sun by a factor of 263,290. We see that one wild card in this measurement is how the profile through the moon's image is selected and since the moon is not uniformly lit, a different selected profile line would most likely result in somewhat different estimate. But the given profile line is pretty good for this first estimate.
Ok, finally the weather improved for at least one night and we were able to complete one more session of observing Polaris rotating around the north celestial pole (NCP). Hooray! This first image just shows my eyeball centered view of Polaris. The star was just visible to my naked eyeballs and I could use the camera tilt and pan method to get Polaris at near frame center.
 |
| Polaris, mostly centered, 600mm, 2 second exposure (Source: Palmia Observatory) |
Then with the help from available apps that show the current location of Polaris with respect to the NCP, the following frame was captured after moving the camera line of sight appropriately. I just guessed about the movement required using the image scale factor of 1.42 degrees in the vertical direction. So, now , with Polaris offset in the camera frame, the NCP should be essentially right at the center of the camera frame.
 |
| Polaris, now offset from estimated position of NCP (Source: Palmia Observatory) |
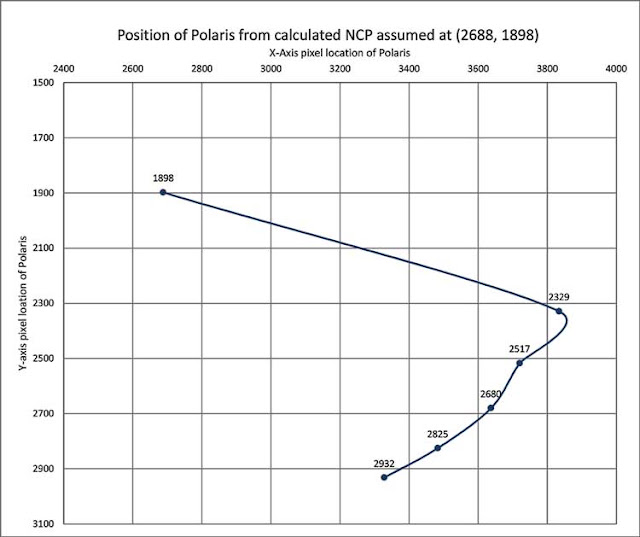
So, if this offset is in the right direction and is of the right amount we should be able to track the movement of Polaris and find that it moves with constant radius around the NCP. To see how well this works out, the observation plan included collecting images of Polaris every 15 minutes and presenting the data as a 30 minute cadence. The spreadsheet below summarizes the findings. AIP4WIN was used to measure the pixel location of Polaris and Excel solver was used to calculate the least squares error location of the NCP in the images.
It is interesting to note that the calculated radius is only 30 arc minutes which is less than expected.
 |
| Summary of Polaris observations at 30 minute cadence (Source: Palmia Observatory) |
Ok, let's plot the motion of Polaris and see what that looks like. The assumed and estimated postion of the NCP is at (2688, 1898). The observations began when y = 2932 and continued up the curve until y = 2329. Oh, oh, the little dip in the curve at y = 2517 coincides with the time when the camera battery pooped out and needed to be changed. Ok, ok, I tried not to disturb the camera and tripod setup, but it seems that there is a little dip where no little dip should be. The observed position of Polaris as the observation went forward was easily observable on the camera Liveview and followed the same counterclockwise track seen in the plot.
Lesson learned: Check the level of battery available so that you do not have to change battery, which almost seems to always include a little bump to the tripod.
 | |
|
Resident Astronomer George
There are over 200 postings of similar topics on this blog
If you are interested in things astronomical or in astrophysics and cosmology

No comments:
Post a Comment